When VS Code slows down, know which machine is struggling
Local VS Code, Remote SSH, and WSL resource status in one place, without jumping between Task Manager, top, and server dashboards.
Watch the remote machine, not only your laptop
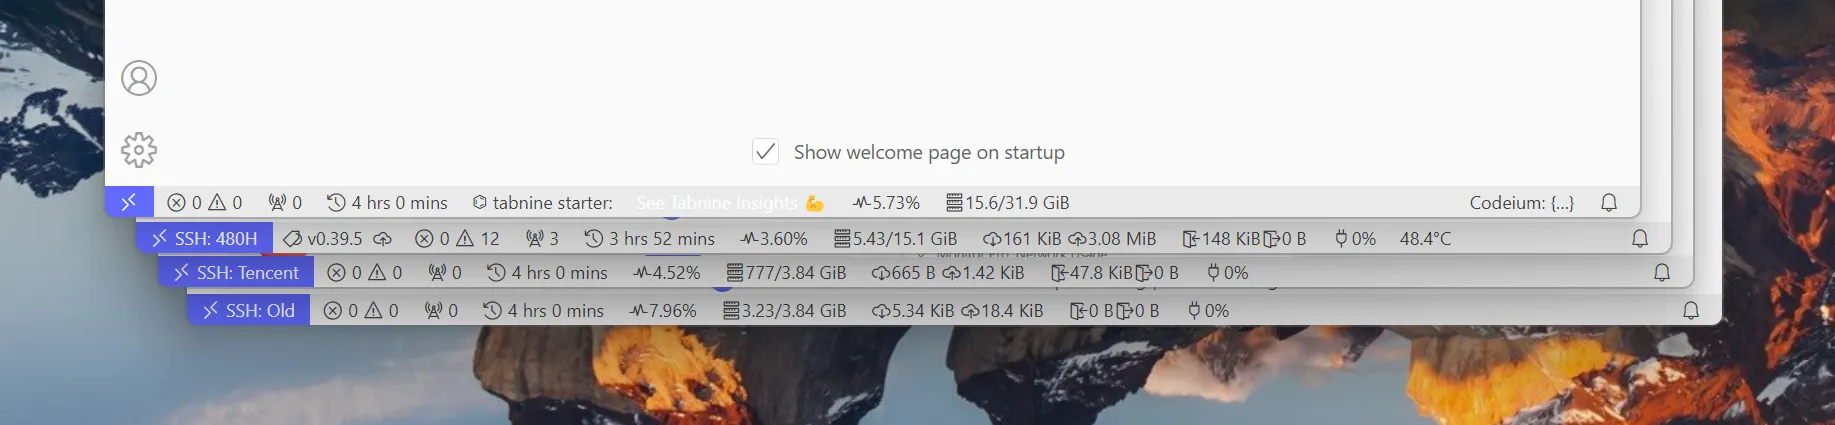
When connected over Remote SSH, Monitor Pro shows server CPU, memory, network, and disk status directly inside VS Code.
Trends instead of one-off numbers
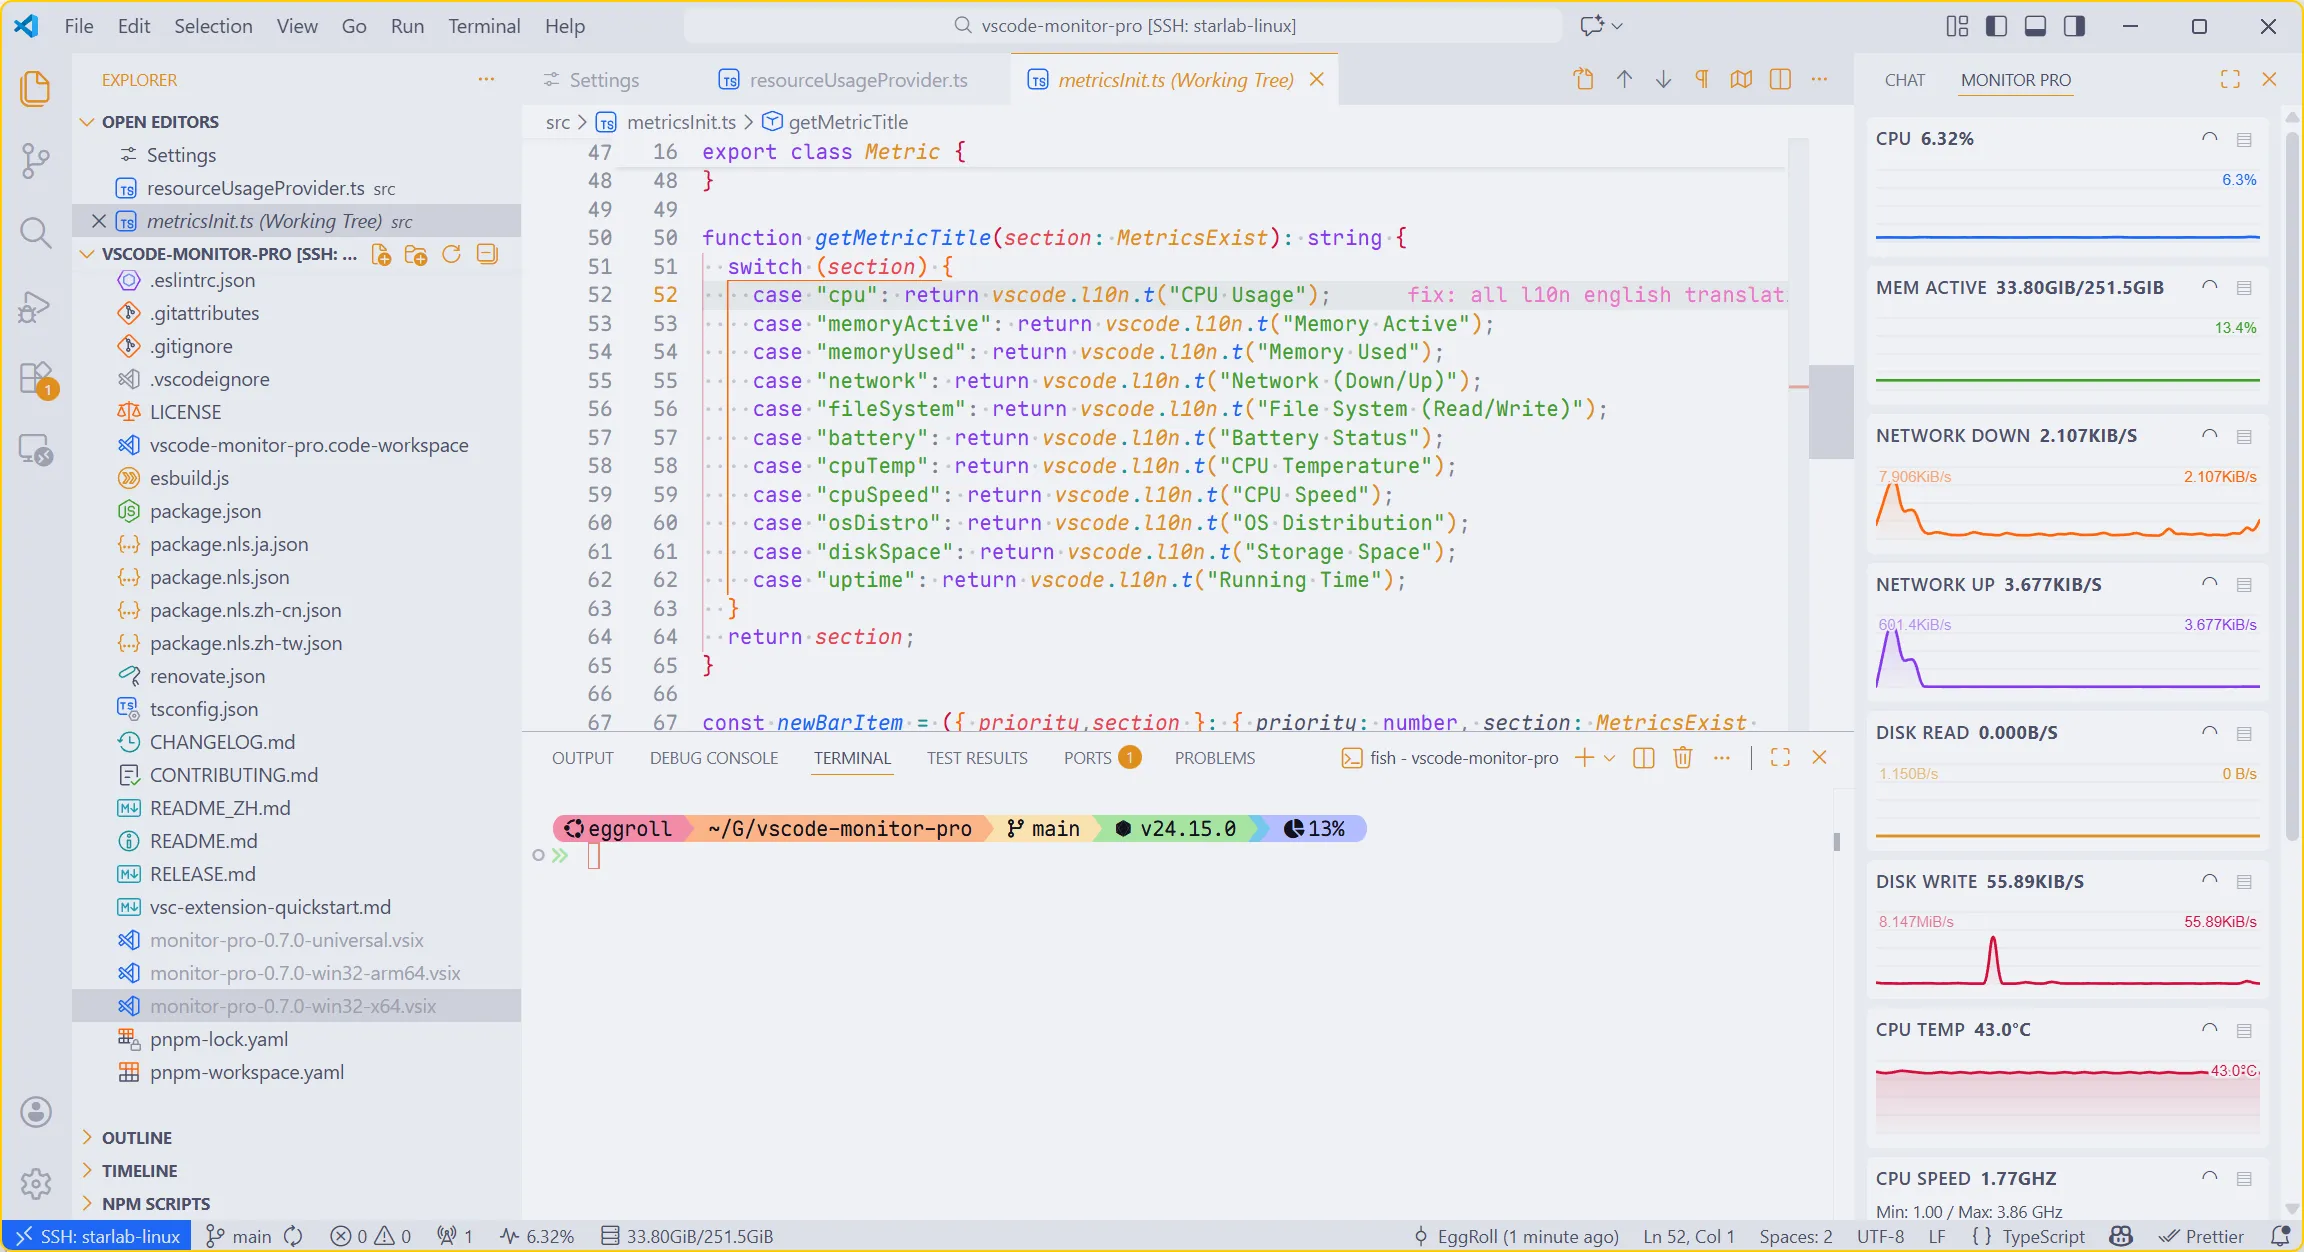
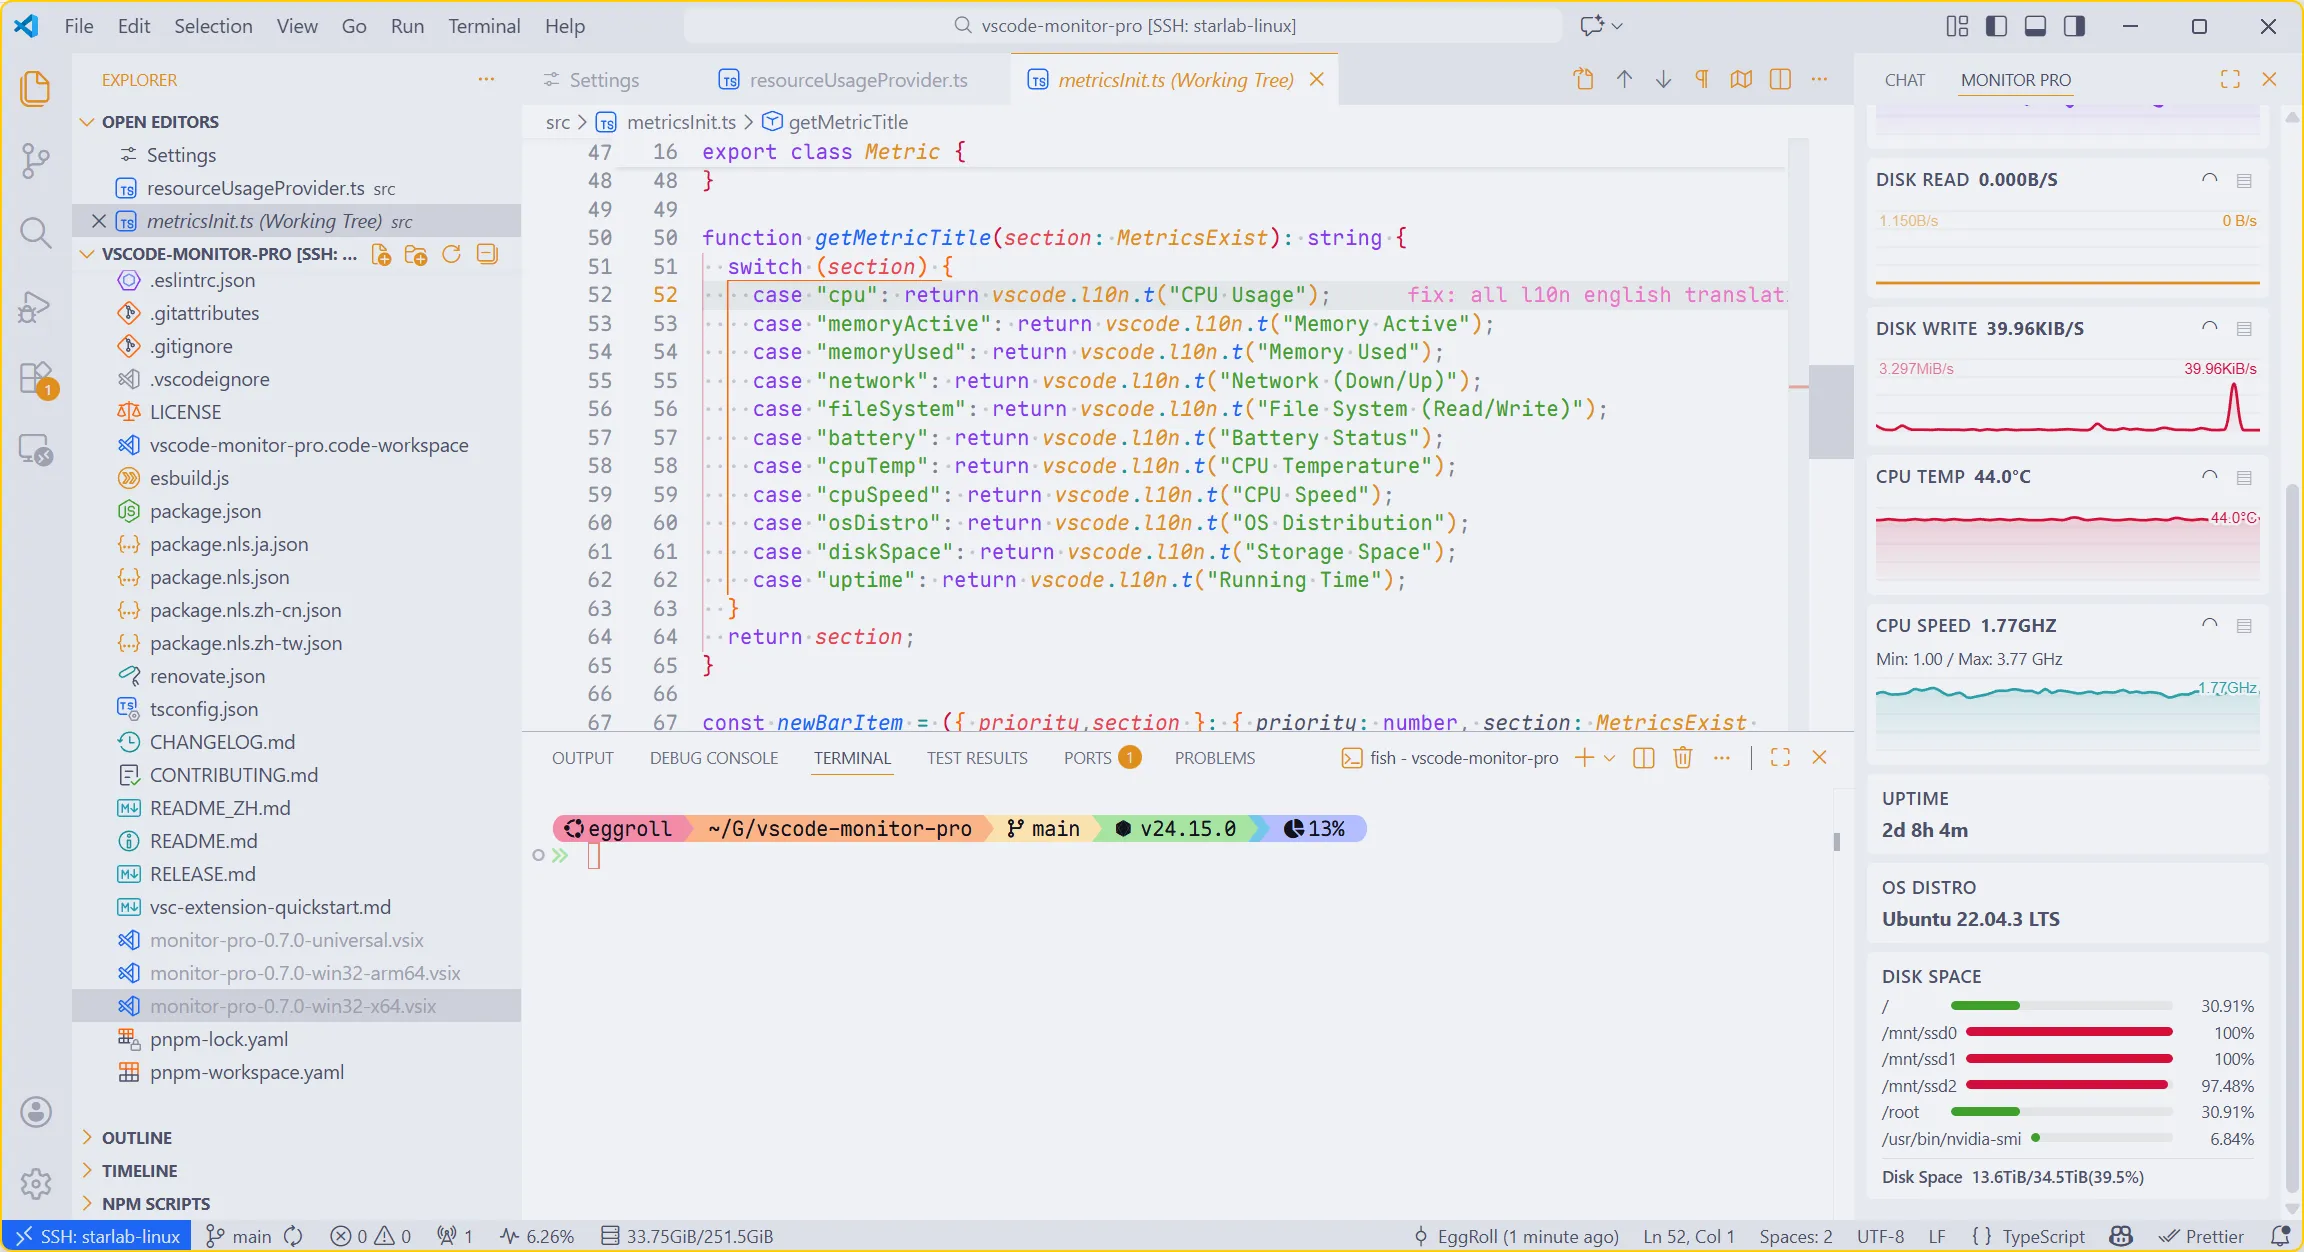
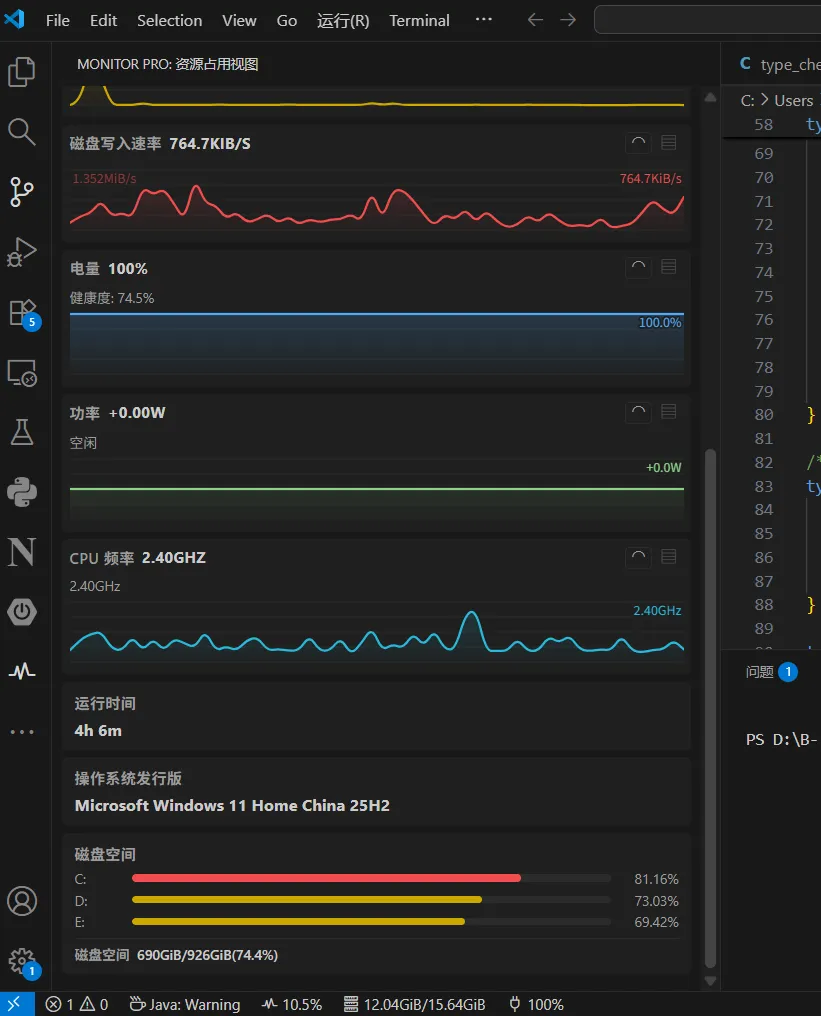
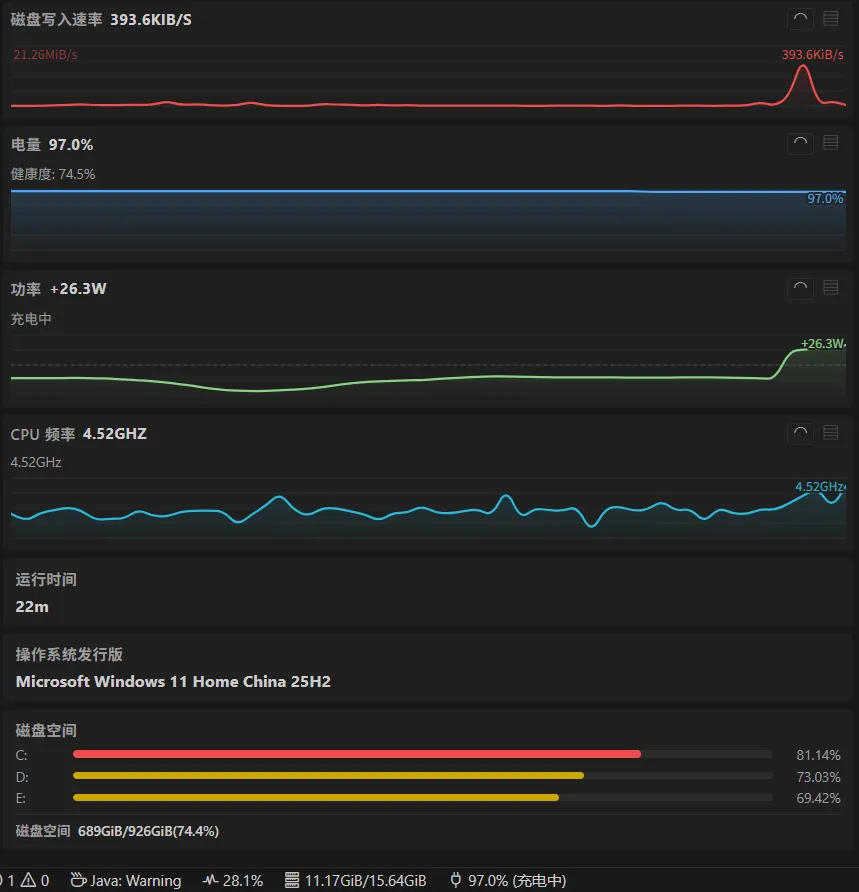
The resource usage panel charts CPU, memory, network, disk, battery, and more, so you can tell sustained load from a short spike.
A quieter status bar
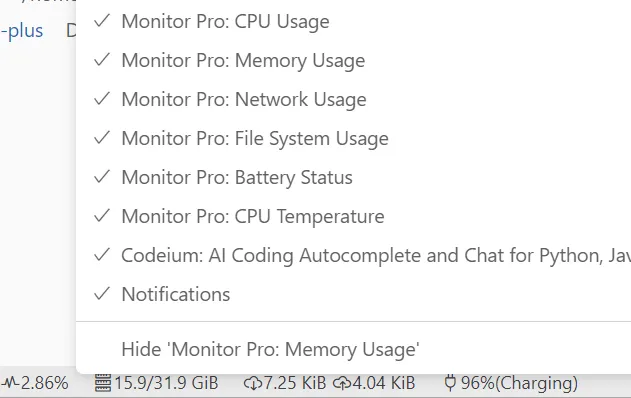
Version 0.7 keeps only CPU, active memory, and battery enabled by default. The status bar stays useful without turning into a wall of numbers.
Battery power, not just battery percent
On supported Windows laptops, Monitor Pro shows charging, discharging, power draw, and battery health so power issues are easier to notice.
Enough for daily debugging, without becoming a full monitoring stack
Monitor Pro is meant to stay open in the editor and quickly tell you where to look next.
Best fit
It is not a replacement for a production monitoring platform. It is a small instrument panel for your development workflow.
Daily development
When installs, builds, or scripts slow down, check whether the machine is already saturated.
Check whether CPU, memory, or disk is the likely reason VS Code feels slow
Look back at resource curves when a build suddenly takes longer
Keep only the essential numbers in the status bar
Remote SSH
When a remote workspace hangs, stop guessing whether the local machine or server is at fault.
View remote server status directly inside VS Code
Read network and disk changes next to CPU and memory
Useful for cloud dev boxes, staging machines, and personal servers
Laptop users
If the machine is plugged in but still draining, you want to notice that early.
Track battery percentage, power state, and power draw
Watch CPU temperature and frequency for possible throttling
Spot unusual power drain during long development sessions
Screenshots